2015 was also the highest ever for installation of renewable power capacity, with 64GW of wind and 57GW of solar PV commissioned during the year, an increase of nearly 30% over 2014.
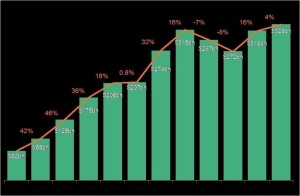
Clean energy investment surged in China, Africa, the US, Latin America and India in 2015, driving the world total to its highest ever figure, of $329.3bn, up 4% from 2014’s revised $315.9bn and beating the previous record, set in 2011 by 3%.
The latest figures from Bloomberg New Energy Finance show dollar investment globally growing in 2015 to nearly six times its 2004 total and a new record of one third of a trillion dollars (see chart on page 3), despite four influences that might have been expected to restrain it.
These were: further declines in the cost of solar photovoltaics, meaning that more capacity could be installed for the same price; the strength of the US currency, reducing the dollar value of non-dollar investment; the continued weakness of the European economy, formerly the powerhouse of renewable energy investment; and perhaps most significantly, the plunge in fossil fuel commodity prices.
Michael Liebreich, chairman of the advisory board at Bloomberg New Energy Finance, said: “These figures are a stunning riposte to all those who expected clean energy investment to stall on falling oil and gas prices. They highlight the improving cost-competitiveness of solar and wind power, driven in part by the move by many countries to reverse-auction new capacity rather than providing advantageous tariffs, a shift that has put producers under continuing price pressure.
“Wind and solar power are now being adopted in many developing countries as a natural and substantial part of the generation mix: they can be produced more cheaply than often high wholesale power prices; they reduce a country’s exposure to expected future fossil fuel prices; and above all they can be built very quickly to meet unfulfilled demand for electricity. And it is very hard to see these trends going backwards, in the light of December’s Paris Climate Agreement.”
Looking at the figures in detail, the biggest piece of the $329.3bn invested in clean energy in 2015 was asset finance of utility-scale projects such as wind farms, solar parks, biomass and waste-to-energy plants and small hydro-electric schemes. This totalled $199bn in 2015, up 6% on the previous year.1
The biggest projects financed last year included a string of large offshore wind arrays in the North Sea and off the coast of China. These included the UK’s 580MW Race Bank and 336MW Galloper, with estimated costs of $2.9bn and $2.3bn respectively, Germany’s 402MW Veja Mate, at $2.1bn, and China’s Longyuan Haian Jiangjiasha and Datang & Jiangsu Binhai, each of 300MW and $850m.
The biggest financing in onshore wind was of the 1.6GW Nafin Mexico portfolio, for an estimated $2.2bn. For solar PV, it was the Silver State South project, at 294MW and about $744m, and for solar thermal or CSP, it was the NOORo portfolio in Morocco, at 350MW and around $1.8bn. The largest biomass project funded was the 330MW Klabin Ortiguera plant in Brazil, at about $921m, and the largest geothermal one was Guris Efeler in Turkey, at 170MW and an estimated $717m.
After asset finance, the next largest piece of clean energy investment was spending on rooftop and other small-scale solar projects. This totaled $67.4bn in 2015, up 12% on the previous year, with Japan by far the biggest market, followed by the US and China.
Preliminary indications are that, thanks to this utility-scale and small-scale activity, both wind and solar PV saw around 30% more capacity installed worldwide in 2015 than in 2014. The wind total for last year is likely to end up at around 64GW, with that for solar just behind at about 57GW. This combined total of 121GW will have made up around half of the net capacity added in all generation technologies (fossil fuel, nuclear and renewable) globally in 2015.
Public market investment in clean energy companies was $14.4bn last year, down 27% from 2014 but in line with the 10-year average. Top deals included a $750m secondary share issue by electric car maker Tesla Motors, and a $688m initial public offering by TerraForm Global, a US-based ‘yieldco’ owning renewable energy projects in emerging markets.
Venture capital and private equity investors pumped $5.6bn into specialist clean energy firms in 2015, up a healthy 27% on the 2014 total but still far below the $12.2bn peak of 2008. The biggest VC/PE deal of last year was $500m for Chinese electric vehicle company NextEV.
There was $20bn of asset finance in clean energy technologies such as smart grid and utility-scale battery storage, representing an 11% rise on 2014, the latest in an unbroken series of annual increases over the past nine years. The final category of clean energy investment, government and corporate research and development spending, totaled $28.3bn in 2015, up just 1%. This figure provides a benchmark for any surge in spending in the wake of announcements at COP21 in Paris by consortia of governments and private investors, led by Bill Gates and Mark Zuckerberg.
National trends
China was again by far the largest investor in clean energy in 2015, increasing its dominance with a 17% increase to $110.5bn, as its government spurred on wind and solar development to meet electricity demand, limit reliance on polluting coal-fired power stations and create international champions.
Second was the US, which invested $56bn, up 8% on the previous year and the strongest figure since the era of the ‘green stimulus’ policies in 2011. Money-raising by quoted ‘yieldcos’, plus solid growth in investment in new solar and wind projects, supported the US total.
Europe again saw lower investment in 2015, at $58.5bn, down 18% on 2014 and its weakest figure since 2006. The UK was by far the strongest market, with investment up 24% to $23.4bn. Germany invested $10.6bn, down 42% on a move to less generous support for solar and, in wind, uncertainty about how a new auction system will work from 2017. France saw an even bigger fall in investment, of 53% to $2.9bn.
Brazil’s clean energy investment slipped 10% to $7.5bn in 2015, while India’s gained 23% to $10.9n, the highest since 2011 but a far cry for the figures needed to implement the Modi government’s ambitious plans. Japan saw investment rise 3% to $43.6bn, on the back of a continuing PV boom. In Canada, clean energy investment fell 43% to $4.1bn, while in Australia, it edged up 16% to $2.9bn.
A number of “new markets” together committed tens of billions of dollars to clean energy last year. These include Mexico ($4.2bn, up 114%), Chile ($3.5bn, up 157%), South Africa ($4.5bn, up 329%) and Morocco ($2bn, up from almost zero in 2014).
Africa and the Middle East are two regions with big potential for clean energy, given their growing populations, plentiful solar and wind resources and, in many African countries, low rates of electricity access. In 2015, these regions combined saw investment of $13.4bn, up 54% on the previous year.

